Trade with Eva: Analytics in action >>
Showing posts with label TACO. Show all posts

Monday, December 6, 2021

Del Taco (TACO) to be acquired by Jack in the Box (JACK) for $12.51/share in cash

  • San Diego, California-based Jack in the Box, which would now have over 2,800 restaurants spanning 25 states, said the deal would help the chain beef up its off-restaurant premise sales. About 99% of Del Taco restaurants feature a drive-thru. 
  

** TACO **


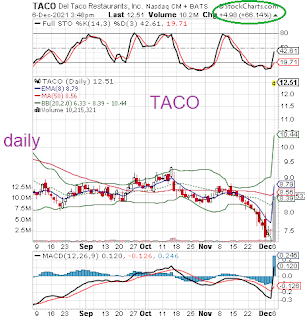
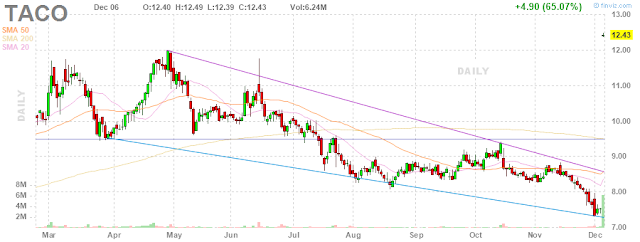
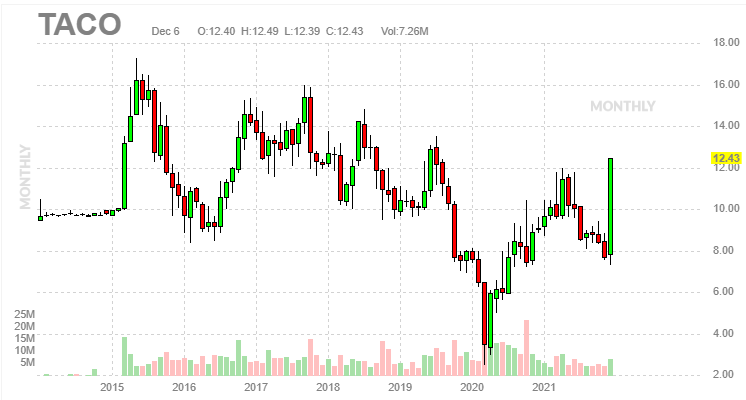
Del Taco to be acquired by Jack in the Box (JACK) for $12.51/share in cash
  • Cos announced that the companies have entered into a definitive agreement pursuant to which Jack in the Box will acquire Del Taco for $12.51 per share in cash in a transaction valued at approximately $575 million, including existing debt. While this price per share offers an attractive premium to Del Taco shareholders, Jack in the Box estimates that the transaction values Del Taco at a synergy adjusted multiple of approximately 7.6x trailing twelve months Adjusted EBITDA.
  • Jack in the Box expects the transaction to be mid-single-digit accretive to earnings per share excluding transaction expenses in year one and meaningfully accretive beginning in year two once full synergizes are realized.
  • Jack in the Box expects the combined company to realize run-rate strategic and cost synergies of approximately $15 million by the end of fiscal year 2023, with approximately half of the synergies achieved in the first year. Jack in the Box expects to achieve these synergies largely through procurement and supply chain savings, technology and digital efficiencies and other financial benefits, as well as knowledge-sharing initiatives.

Monday, October 21, 2019

Del Taco (TACO) earnings on Mon 21 Oct March 19 (a/h)

** charts before earnings **


** charts after earnings **


Del Taco misses by $0.04, reports revs in-line; lowers FY19 EPS and rev guidance

  • Reports Q3 (Sep) earnings of $0.10 per share, excluding non-recurring items, $0.04 worse than the S&P Capital IQ Consensus of $0.14; revenues rose 2.0% year/year to $120.2 mln vs the $119.27 mln S&P Capital IQ Consensus.
  • Co issues guidance for FY19, sees EPS of $0.44-0.47 from $0.47-0.52 vs. $0.50 S&P Capital IQ Consensus; sees FY19 revs of $512-515 mln from $517-527 mln vs. $514.26 mln S&P Capital IQ Consensus. System-wide comparable restaurant sales growth of ~1% with franchise outperformance (previously low-single digits).
  • "We have since experienced an improvement in company-operated sales and transaction trends during the fourth quarter as we continue to activate and embed our transaction driving initiatives. Specifically, we have made great progress against our digital transformation following the late third quarter launch of Postmates in substantially all company-operated restaurants along with ramping up the Del App to over 800,000 registered users."

  • Earnings this week : Oct 21 - 25, 19 (wk 43)

    Monday (Oct 21)
    • Morning: HAL LII PETS SAP
    • Afternoon: ACC ELS HXL HMST LOGI AMTD  TACO

    Tuesday (Oct 22)
    • Morning: ABG BIIB CNC GATX HOG HAS JBLU KMB LMT MCD PCAR  PII PG DGX SERV  SHW TRV  TTS  UTX UPS
    • Afternoon: BYD CMG CNI CSGP CSL DFS EEFT EQR FMBI FULT HA HCSG HIW IRBT LRN MANH MPWR MTH NAVI NBHC NBTB NTB SIX SKX SNAP TER TRMK TXN UCBI USNA WHR WRB

    Wednesday (Oct 23)
    • Morning: ABB ALKS ALXN ANTM APH AVY BA BANC BCO BKU BOKF BPOP BSX BX CADE CAT CLF CMC CSTM EVR FCFS FCX FSV GD GWW HLT HRI HTLD IVZ KNX LAD LLY MHO MKTX NDAQ NSC NTRS OC PB PNR RCI RES ROL SALT SCL SLAB SLGN TDY TMO TZOO UNF WGO WM
    • Afternoon: AEM AKR ALGN AMP APY ARI ASGN BCOV BMRN BXMT CLB CLGX CMRE CP CUBI CUZ CVBF DHT EBAY ECHO EFX EGP EIG ESRT ESS EW F FBHS FFIV FR FTI GGG GL HNI ICLR ISBC KALU KNL KRA KRC LMAT LRCX LSTR LVS MKSI MSA MSFT MX NGVT NOW NTGR NXGN ORLY PKG PLXS PTC PYPL QEP RHI RJF RRC SAVE SEIC SLM SRPT STL SUI TRN TSLA UFPI VAR VMI WPG WSBC XLNX
    Thursday (Oct 24)
    • Morning: AAL AB ADS AEP AIMC ALLE ASPS AXTA AZN BAX BC BGCP CMCS.A CMS COLB COWN CRI CRS CTS CTXS DHR DOW ENTG FAF FCN GNC GPI GRA HBAN HEES HSY IART KIM LH LUV MMM MNRO MSM MTRN NOC NOK ODFL ONDK ORI PATK PDS PRLB PTEN ROP RS RTN SAH SCHN STM SWK TAL TECK TROW TRTN TSCO TWTR UBSI VC VLO VLY WST XEL
    • Afternoon: AFL AJG ALGT ALK AMZN ANIK ASB AUY AVT BHE BJRI BOOM CERN CINF CLS COF COG CSLT CUBE CVA CXP CY DECK DLX EHTH EMN ENVA FET FHB FII FIX FLEX FSLR FTV FWRD GCAP GILD HLI ILMN INTC JNPR KN LOGM LPLA MHK MXL NTUS OIS OMCL OSIS PEB PFG PFPT POWI PRO RMD SBCF SIVB SPSC SWN TNET UHS V VCRA VRSN VVI WERN WRE 

    Friday (Oct 125)
    • Morning: ALV AON B BEN BUD CHTR GBX GRC GT GVA HUN ITW KEX LEA NRZ PFS PSX PSXP ROCK SBSI SJR TILE UFS VFC VRTS VTR VZ WETF WY YNDX


    Reports this week:
    • Monday: No economic data scheduled
    • Tuesday: September Existing Home Sales (prior 5.49 mln) at 10:00 ET and $40 bln 2-yr Treasury note auction results at 13:00 ET
    • Wednesday: Weekly MBA Mortgage Index (prior 0.5%) at 7:00 ET; August FHFA Housing Price Index (prior 0.4%) at 9:00 ET; weekly crude oil inventories (prior +8.0 mln) at 10:30 ET; and $41 bln 5-yr Treasury note auction results at 13:00 ET
    • Thursday: Weekly Initial Claims (prior 214,000), Continuing Claims (prior 1.679 mln), September Durable Orders (prior 0.2%), and Durable Orders ex-transportation (prior 0.5%) at 8:30 ET; September New Home Sales (prior 713,000) at 10:00 ET; weekly natural gas inventories (prior +104 bcf) at 10:30 ET; and $32 bln 7-yr Treasury note auction results at 13:00 ET
    • Friday: Final October Michigan Consumer Sentiment Survey (prior 96.0) at 10:00 ET
    Notable earnings reports: 
    • Halliburton (NYSE:HAL), SAP SE (NYSE:SAP) and TD Ameritrade (NASDAQ:AMTD) on October 21; 
    • UPS (UPS), McDonald's (MCD), Procter & Gamble (PG), Travelers (NYSE:TRV), United Technologies (NYSE:UTX), Centene (NYSE:CNC), Chipotle (NYSE:CMG), Lockheed Martin (NYSE:LMT), Discover Financial Services (NYSE:DFS), Hasbro (NASDAQ:HAS) and Kimberly-Clark (NYSE:KMB) on October 22; 
    • Boeing (BA), Caterpillar (CAT), Microsoft (NASDAQ:MSFT), Anthem (NYSE:ANTM), Blackstone (NYSE:BX), Boston Scientific (NYSE:BSX), Canadian Pacific (NYSE:CP), Cleveland-Cliffs (NYSE:CLF), eBay (NASDAQ:EBAY), Edwards Lifesciences (NYSE:EW), Eli Lilly (NYSE:ELY), Equifax (NYSE:EFX), F5 Networks (NASDAQ:FFIV), Ford (NYSE:F), PayPal (NASDAQ:PYPL), Tesla (TSLA) and General Dynamics (NYSE:GD) on October 23; 
    • Intel (INTC), Visa (NYSE:V), Amazon (AMZN), Comcast (NASDAQ:CMCSA), Raytheon (NYSE:RTN), Southwest Airlines (NYSE:LUV), T-Mobile (NASDAQ:TMUS), Twitter (TWTR) and Northrop Grumman (NGC) on October 24; 
    • Verizon (NYSE:VZ) and Anheuser-Busch InBev (NYSE:BUD) on October 25. 

    Monday, March 18, 2019

    Del Taco (TACO) earnings on Mon 18 March 19 (a/h)

    ** charts before earnings **


    ** charts after earnings **


    Del Taco misses by $0.01, reports revs in-line; guides FY19 EPS below consensus, revs in-line
    • Reports Q4 (Dec) earnings of $0.18 per share, excluding non-recurring items, $0.01 worse than the S&P Capital IQ Consensus of $0.19; revenues rose 7.4% year/year to $157.3 mln vs the $157.01 mln S&P Capital IQ Consensus. 
    • System-wide comparable restaurant sales growth of 2.5% and company-operated comparable restaurant sales growth of 1.5%, marking the 6th consecutive year of gains; Company-operated comparable restaurant sales growth comprised average check growth of 3.6%, including slightly positive menu mix growth, partially offset by a transaction decrease of 2.1%;
    • Co issues guidance for FY19, sees EPS of $0.47-0.52, excluding non-recurring items, vs. $0.58 S&P Capital IQ Consensus; sees FY19 revs of $517-527 mln vs. $518.25 mln S&P Capital IQ Consensus. System-wide comparable restaurant sales growth of low-single digits.

    Tuesday, October 16, 2018

    Del Taco (TACO) reported earnings on Tue 16 Oct 2018 (a/h)

    ** charts before earnings **


    ** charts after earnings **


    Del Taco beats by $0.01, misses on revs; guides FY18 EPS below consensus, revs below consensus 
    • Reports Q3 (Sep) earnings of $0.15 per share, excluding non-recurring items, $0.01 better than the S&P Capital IQ Consensus of $0.14; revenues rose 6.2% year/year to $117.83 mln vs the $119.84 mln S&P Capital IQ Consensus. Comparable restaurant sales increased 1.4% system-wide, resulting in a 5.5% increase on a two-year basis.
    • Co issues downside guidance for FY18, sees EPS of ~$0.53-0.56, excluding non-recurring items, vs. $0.61 S&P Capital IQ Consensus; sees FY18 revs of $504-507 mln vs. $511.68 mln S&P Capital IQ Consensus.
      • System-wide same store sales growth of approximately 3% (previously 2% to 4%);

    Monday, October 15, 2018

    Earnings this week : October 15 - 19, 2018 (wk 42)

    Earnings confirmed to report this week

    Monday (Oct 15)
    • Morning: BAC  
    • Afternoon: JBHT

    Tuesday (Oct 16)
    • Morning: BLK  CMA FHN DPZ GS  GWW JNJ MS OMC PGR PLD  UNH
    • Afternoon:  ADTN CREE CSX FULT HCSG HOPE HWC IBKR IBM  LRCX LTXB MRTN NFLX  PNFP SONC TACO  UAL UFPI

    Wednesday (Oct 17)
    • Morning: ABT ASML BMI MTB MTG NTRS SVU UNF USB WGO
    • Afternoon:  AA BDN BXS CATY CCI CCK CNS EGBN KALU KMI SLG STLD TBK TCBI UMPQ URI WTFC

    Thursday (Oct 18)
    • Morning:  ADS BBT BK BX DHR DOV ERIC EWBC GPC GTLS HOMB IIIN KEY LNN MDSO NUE NVR NVS PM POOL PPG SAP SASR SBNY SNA SON TRV TSM TTS TXT WBC WBS
    • Afternoon: AXP CP CE ETFC EXPO ISRG PYPL SKX WDFC WERN 

    Friday (Oct 18)
    • Morning: CLF HON IPG KSU MAN MINI PG RCI VFC


    Thur Oct 18 a/h

    Friday, October 20, 2017

    This week's biggest % winners & losers : Oct. 16 - 20, 2017 (wk 42)

    The following are this week's top 20 percentage gainers and top 20 percentage losers, categorized by sectors (over $300 mln market cap and 100K average daily volume).

    This week's top 20 % gainers
    • Healthcare: SPPI (19.32 +44.61%), CRBP (7.75 +13.97%), CYH (6.44 +11.61%), THC (14.66 +11.48%), TXMD (5.11 +11.46%)
    • Materials: VHI (3.36 +14.68%)
    • Industrials: GWW (207.81 +14.78%), SALT (8.2 +13.1%),
    • Consumer Discretionary: SKX (33.99 +39.59%), ASNA (2 +12.36%), EXPR (6.62 +12.2%), BOOT (8.3 +11.71%), SCSS (33.99 +10.97%)
    • Information Technology: TEAM (50.01 +26.16%), SYNT (24.22 +24.88%), NPTN (5.46 +15.43%), CREE (33.82 +15.17%), ADBE (175.46 +13.99%)
    • Energy: CLD (4.58 +25.14%)
    • Utilities: TERP (13.56 +13%)

    This week's top 20 % losers
    • Healthcare: ARDX (5.55 -23.71%), MNKD (4.13 -21.85%), TRVN (1.76 -19.63%), CELG (121.4 -11.04%)
    • Materials: KLDX (3.22 -16.15%), HMY (1.66 -11.7%)
    • Industrials: UAL (59.9 -11.35%)
    • Consumer Discretionary: TACO (12.65 -16.61%), CTRP (48.43 -12.25%)
    • Information Technology: SNCR (11.43 -19.22%), BMI (43.8 -14.79%), BHE (30.5 -14.08%), NCR (33.05 -11.96%), AAOI (41.41 -11.91%), MTSI (36.99 -11.06%)
    • Financials: VIRT (14.3 -16.13%)
    • Energy: KEG (10.58 -14.75%), FMSA (3.88 -14.73%), SPN (8.85 -12.98%)
    • Consumer Staples: SVU (15.03 -25.59%)

    Thursday, October 19, 2017

    Del Taco (TACO) reported earnings on Thur 19 Oct 2017 (a/h)

    ** charts after earnings **


    ** monthly **


    Del Taco reports EPS in-line, revs in-line; System-wide and Co-operated comparable restaurant sales growth of 4.1% and 3.7%; lowers FY17 EPS below consensus, narrows revs in-line
    • Reports Q3 (Sep) earnings of $0.13 per share, in-line with the Capital IQ Consensus of $0.13; revenues rose 6.3% year/year to $110.99 mln vs the $110.46 mln Capital IQ Consensus.
      • System-wide and Company-operated comparable restaurant sales growth of 4.1% and 3.7%. 
        • Company-operated comparable restaurant sales growth was comprised of average check growth of 4.0%, including approximately 1.5% of menu mix growth, partially offset by a transaction decline of 0.3%.
      • The opening of two company-operated and two franchise restaurants.
    • Co issues guidance for FY17, sees EPS of $0.52-$0.54 (prior: $0.52-0.55) vs. $0.56 Capital IQ Consensus Estimate; sees FY17 revs of $472-$475 mln (prior: $470-476 mln) vs. $472.65 mln Capital IQ Consensus Estimate.
      • Adjusted EBITDA between $71.5 million and $72.5 million (previously $71.5 and $73.5). 
      • Restaurant contribution margin between 19.5% and 19.8% (was 19.8% to 20.3%).
      • General and administrative expenses of between approximately 8.1% and 8.3% of total revenue (previously 8.2% and 8.4%).
      • Effective tax rate of approximately 39.0% (previously 40.0%).
      • Reaffirms net capital expenditures totaling approximately $43.0 million to $46.0 million. 
    • John D. Cappasola, Jr., President and Chief Executive Officer of Del Taco, commented, "During the third quarter, our company-operated and franchised restaurants both extended their track records of positive comparable restaurant sales, and The Del Taco system as a whole achieved 10.8% growth in comparable restaurant sales on a two-year stacked basis. We successfully executed our strategy to lap last year's accelerated performance by combining comprehensive improvement across the brand with an impactful marketing plan. We raised the bar in operations by focusing on improving our Overall Satisfaction Scores and Lunch and Dinner Speed compared to last year, embedding awareness and usage of The Del Taco and Platos, and reintroducing Carnitas as a limited time offer. We finished the quarter with our launch of Queso, a highly relevant and elevated QSR+ ingredient that is currently mixing at approximately 7% of sales and will enable exciting future product innovation across our menu."

    Tuesday, August 29, 2017

    Thursday, May 4, 2017

    Del Taco Restaurants (TACO) reported earnings Thur 4 May 2017 (a/h)


    • IPO:  June 30, 2015

    ** charts after earnings **


    • Del Taco beats Street 1Q forecasts
    LAKE FOREST, Calif. (AP) _ Del Taco Restaurants Inc. (TACO) on Thursday reported first-quarter earnings of $4.2 million.

    The Lake Forest, California-based company said it had net income of 10 cents per share.

    The results surpassed Wall Street expectations. The average estimate of four analysts surveyed by Zacks Investment Research was for earnings of 9 cents per share.

    The restaurant chain posted revenue of $105.3 million in the period, also exceeding Street forecasts. Three analysts surveyed by Zacks expected $105 million.

    Del Taco expects full-year earnings to be 52 cents to 55 cents per share, with revenue in the range of $466 million to $476 million.

    Del Taco shares have decreased 5 percent since the beginning of the year. In the final minutes of trading on Thursday, shares hit $13.40, a rise of 35 percent in the last 12 months.

    Monday, October 17, 2016

    Del Taco Restaurants (TACO) reported earnings on Mon 17 Oct 2016 (a/h)

    ** charts after earnings **


    *** 3 weeks later ***


    Del Taco Restaurants reported a third quarter EPS beat on better than expected same-store sales and lower food costs.

    Del Taco's adjusted EPS/EBITDA of $0.14/$17 million came in ahead of expectations for $0.12 and about $15 million, respectively.

    The restaurant’s same-store sales came in at 6.7 percent, also topping consensus view of 3.7 percent, following the successful re-launch/refresh of its “Combined Solutions” program and rollout of the new "Del Taco" taco.

    “We think the brand is well positioned to compete in this kind of environment, and would be buyers of the stock, as fundamentals are improving & valuation attractive at 9x '17 EBITDA,” Jefferies analyst Andy Barish wrote in a note.

    In addition, menu pricing ensured that the company’s check growth remains in the mid-single digit range. The company also saw positive menu mix on strong demand for both new premium, as well as value-oriented products.

    Looking ahead, the company projects fourth quarter same store sales inline with the 4.4 percent year-to-date trend. For the full year, the company sees system-wide same-store sales growth at the high end of the previous 2.5 to 4.5 percent range and raised total revenue forecast to between $446-$449 million from prior range of $439-$449 million.